| Build 6.5 |
17th January 2025 |
| |
1. Updated to match latest release of Dew Lab Studio with dll versions.
2. Considerably improved the speed of peak marking.
3. Much faster CZT algorithm.
4. A number of smaller bug fixes.
|
| Build 6.3 |
20th November 2020 |
| |
1. Updated to match latest release of Dew Lab Studio with dll versions.
2. Added ability for recursive peak interpolation of harmonics on the frequency spectrum.
3. Reports can use "tab" charachter as a column delimiter, which is handy when importing/copying to Excel.
|
| Build 6.1 |
14th November 2017 |
| |
1. Bug fix for WASAPI recorder. Greatly increased number of supported hardware devices and Exclusive mode compatibility.
2. Bug fix for marking peaks on averaged spectrum.
3. Bug fix for the chart update of the Surface spectrogram.
4. New "Envelope sampling frequency" parameter in the recording module settings.
5. New smooth playback allows looping of arbitrariliy short sections of a file without skipping. |
| Build 6.0 |
25th September 2016 |
| |
1. Real-time spectrogram for recorder
2. WASAPI API for recorder
3. Enhanced spectrogram performance and color spectrum |
| Build 5.5.1.00 |
1st February 2015 |
| |
1. UI cosmetics fixes
2. Installer update |
| Build 5.5.0.22 |
1st January 2015 |
| |
1. Support for Unicode
2. Many new charting features
3. Native 64bit build removing the 2GB RAM usage limit.
4. Faster execution due to direct support for latest Intel instruction sets.
5. New look and feel |
| Build 5.0.4.19 |
9th September 2009 |
| |
1. Enhanced Orbital X-Y chart and several bugs fixed in still field.
2. New cross-spectrum analyzer.
3. Fixed a bug related to Windows 7 and opening of wav files.
4. Fixed a bug related to wrong working dir file path which required manual intervention to have Processing menu commands working right.
5. Many people could not find the manual. There is now a link to it from the Help menu.
|
| Build 5.0.4.7 |
16th June 2009 |
| |
1. Added spectrum measurement tools to normalize any frequency or amplitude to 1 and examine factors between peaks directly.
2. Orbital X-Y chart. Uses Hilbert transform for 1 channel and requires complex signal on the input for X-Y drawing.
3. Added default audio input checkbox for the Signal Recorder.
4. Added ability to display Phase, Unwrapped phase, Delay in seconds vs Freq and Group Delay for the frequency spectrum.
5. Fixed compatibility issues with older CPU's.
6. The install performs uninstall before installing.
7. The rate conversion now allows also explicitly set target sampling frequency independently from the conversion factor. (changing the speed of the file.)
8. Several minor fixes.
|
| Build 5.0.4 |
1st May 2009 |
| |
1. New signal generator. Support for playback, live signal control and multiple channels.
2. Several improvements made for txt file import file filter.
|
| Build 5.0.3.38 |
31st March 2009 |
| |
1. New Digital filter designer.
2. New Cross correlation analysis.
3. Several minor fixes for multi-file analysis.
4. Updated the users manual with instructions for using the "Signal processing" routines and batch file analysis.
|
| Build 5.0.3.28 |
4th March 2009 |
| |
1. Multi-core processing enabled for digital filtering and FFT.
2. Overview (peak) files are now stored in the working directory which can easily be purged.
3. Several minor fixes when it comes to navigating multiple files.
4. The app license key has changed and registered users need to obtain an updated one(free of charge) to use versions from this onward.
5. Whenever upgrading, uninstall the previous version. Old configuration files will not be compatible with the new version.
|
| Build 5.0.3 |
5th January 2009 |
| |
1. Fix to overview chart in the signal recorder. A graphical error caused lock ups.
2. Fix to one zoom spectrum configuration giving an error message.
3. The linked channel will now work also while editing the settings for the spectrum analyzer.
4. Signal analyzer now allows selection of multiple channels and concurrent operations on them. (Hold shift to select more than one).
5. Channel color is now specified in the channel configuration and matches in the overview chart and the analysis charts.
|
| Build 5.0.2.90 |
9th December 2008 |
| |
1. Added ability to compare spectrograms and surface charts by optionaly freezing the color scale.
2. Improved memory management allows much larger and faster spectrograms.
3. Fixed a bug when an error was reported at startup on Vista OS.
|
| Build 5.0.2.71 |
10th November 2008 |
| |
1.Another fix to the peak marking feature
2.Fixed the surface chart.
3.Filtering peaks from the spectrum will also update the associated time signal chart.
4.Signal recorder now has a reset averaging button.
5.Peak marking has been speeded up.
|
| Build 5.0.2.57 |
30th April 2008 |
| |
1.Fixed the peak marking feature
2.Added ability to load, display and analyze complex/analytical signals.
3.Raw/pcm/txt file format support improved.
|
| Build 5.0.2.50 |
21st April 2008 |
| |
1.Added Allow 24bit playback and Amplify to dynamic range check-boxes to the Playback options to allow playback of non-audio files (Signal Analyzer)
2. Substantially improved speed of the overview chart with multiple bug fixes.
3.The time signal and frequency chart series drawing speed is much higher.
4. Added ability to select the recording source in the Signal Recorder.
5. New zoom spectrum capability in Signal Recorder allows monitoring of arbitrarily narrow band signals in real time.
6. Both Signal Recorder and Signal Analyzer now support allow loading and saving of settings including the configuration of all the charts and file views.
7. Signal Analyzer now has a new Processing menu, with multithreaded batch file processing functions for scaling, multiplexing, cutting, demultiplexing, filtering, rate conversion, file conversion between wav, text and raw/pcm formats, modulation, demodulation, envelope detection, and very narrow band bandpass digital filters
|
| Build 5.0.0.39 |
4th December 2007 |
| |
1. Valid error messages no longer halt the app. This gave false impression before that there are more bugs there than there really were.
2. Added ability to loop the playback and limit the playback to selection.
3. Users manual is now available explaining all the major features.
|
| Build 5.0.0.35 |
27. November 2007 |
| |
1. Fixed playback bug in the Signal Analyzer.
2. Analysis windows are now disabled before recording begins in Signal Recording to prevent errors that would happen in case of no data.
3. New channel scale and offset options for the recording settings for signal calibration purposes.
|
| Version 5 |
23. November 2007 |
| |
Common new features:
1. Completely new application
2. Support for multi-core CPU's and Intel Penryn. Features CPU specific optimizations for SSE2, SSE3 and SSE4a instruction sets
3. The application has been broken in two pieces: Signal Analyzer and Signal Recorder. This simplifies the user interface greatly.
4.There are now two versions of the program. One is runnnig in single precision floating ponit (32 bit accuracy) and the other in double precision floating point (64bit accuracy). The double precision version is more accurate, and the single precision version uses only half the memory and is about two times faster in nearly all operations. That is the only difference between them.
5. The application has a very extensive error reporting tool built in, allowing the user to quickly obtain a bug fix, if needed.
6. The most important thing to learn about how the charts work, is the auto scale feature. The charts will maintain its scale about 20% above the highest peak detected until reset. The Peak Scale reset button is on the toolbar above the chart.
7. Frequency analysis settings require a separate manual to explain in depth. Most usefull for the start are reporting features and ability to compute RMS from any or multiple bands from the spectrum.
8. It makes sense to use FFT Properties v3 to first learn about frequency analysis before starting to use v5. Many of the features used in v5 are explained there. Signal analyzer specific features:
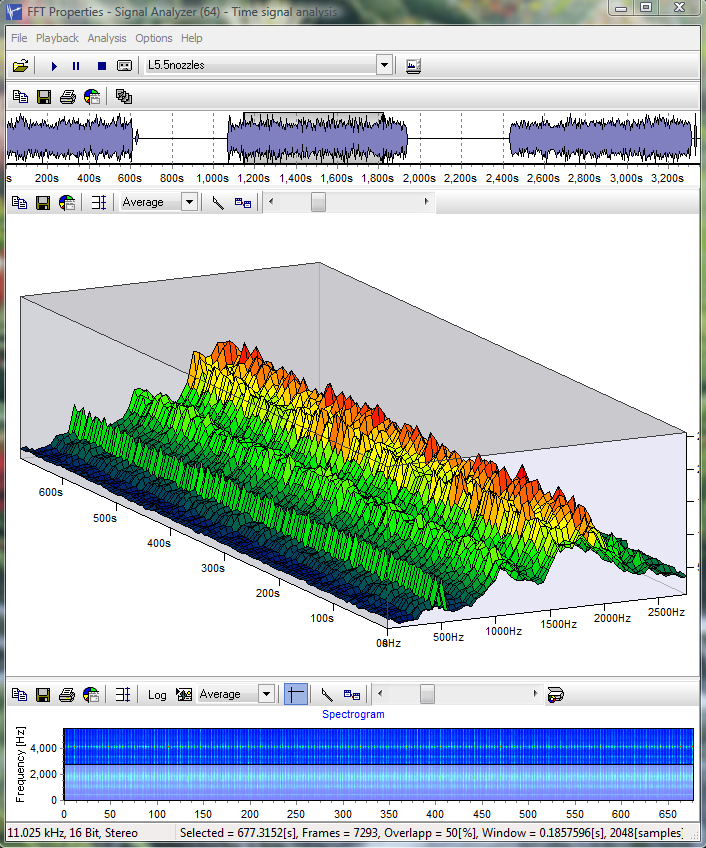
1. After opening a wav file, you will be presented with the file overview. By clicking and dragging the selection box, you can change its size and position and navigate through the file. When the analysis selected is "Averaged" or "Spectrogram" or "Surface", you have to hold down the SHIFT key to make a selection, otherwise you are only zooming. To pan the overview chart, drag it with the right mouse button. To select entire chart, double click it. The spectrogram, averaged spectrum and surface chart can be computed by pressing F9.
2. The new spectrogram has multiple color scale options including rainbow. The color palette can be made from three colors or two colors and each transition can be also mixed with the rainbow. The spectrogram can be recomputed by pressing F9. The spectrogram visualization is pixel accurate and does not allow Windows to make bitmap approximation when resizing. The spectrogram can be panned by dragging the chart with the right mouse button and zoomed in in the usual way: drag with the left mouse button down and right. You can zoom out by dragging the left mouse button up and left. This is true for all the charts except the Surface chart
3. The new 3D Surface diagram allows full 360 degree rotation in all directions. It shares the color palette options with the spectrogram. It is also possible to adjust the resolution of the grid. The surface is navigated with a selection window on the spectrogram. Use CTRL and SHIFT when resizing and moving the selection window. You can zoom in and out of the surface chart by dragging the right mouse button vertically up and down. Dragging with the left mouse button will rotate the surface.
4. When adding marks to the spectrum chart, they can all be deleted, by simply double clicking on the chart. Clicking on the same mark again, will eraise it.
5. Each spectrum "analysis" has its own settings. Known issues:
1. Save/Load settings does not work right yet.
2. The status bar does not show correct window count when using Surface, Spectrogram and Averaged analysis.Signal recorder specific features:
1. Shows time signal and frequency analysis of the energy (RMS) and of the envelope of the signal. Energy and envelope allow tracking of very low frequencies in the signal (modulated).
2. It is possible to record at any sampling frequency supported by the sound card and bit depth of up to 24bit on two channels stereo.
3. The recording can be paused separately from the screens. It is possible to disable monitoring for a while to examine the charts, and allow the recording to continue in the background.
4. The overview chart is not navigatable and can not be zoomed.
5. It is possible to adjust the averaging method of the frequency spectrums displayed to the type that best suites the purpose. There are many methods available: linear, exponential, peak hold and peak hold exponential.
|
| Repack |
22. September 2005 |
| |
1. Updated documentation
2. Updated dlls with support for SSE2 and P4
|
| Build 233 |
12. December 1999 |
| |
1. Added support for floating point number format when saving to text files. (.asc and .sgr)
2. Save spectrum from the File menu now works correctly.
3. Documentation is now in Adobe Acrobat format.
|
| Build 232 |
11. September 1999 |
| |
1. Printing did not advance signal automatically. (down the signal and across records).
2. Sampling frequency info did not change after decimation.
3. Improved source button switching.
4. On some computers (NT) CPU load indicator does not work. This causes memory leak. (not fixed).
5. Default templates with printing colors set to B/W are now included in the distribution.
(You must save the template immediately after starting FFTProp).
6. Saving .wav and .bin files. Improved save options dialog behavior.
7. Added support for 32 bit integer wav files.
8. Added support for 96kHz, 88.2kHz and 48kHz wav files.
9. Zero padding of more then 2 causes memory leak, when streaming from the sound card. (not fixed). |
| Version: 3.5 |
Changes from ver 3.01 to 3.5 (August 1999) |
| |
1. Real time record and play monitoring.
2. CPU load indicator.
3. User definable screen update frequency.
4. Double precision allows phase angle measurement with 0.000001 degree accuracy.
5. Auto and single trigger.
6. Trigger on peak, border pass, (post/pre trigger).
7. Trigger channel can be different from data channel.
8. Bode plots: Amplitude - Frequency, Phase - frequency.
9. Peak hold averaging.
10. Write on trigger.
11. User definable sine sweep speed.
12. On-line wavelet analysis.
|
| Version: 3.01 |
Changes from ver 3.0 to 3.01 (June 1999) |
| |
1. Peak filtering
2. Totally accurate phase measurement for all non-periodic signals. (with a reference at the begining of the time window).
3. SNR, SINAD, SFDR, Noise-floor statistics.
|
| Version: 3.0 |
Changes from ver 2.5 to 3.0 (April 1999) |
| |
1. Real spectrum
2. Imaginary spectrum
3. Cross-correlation
4. Auto-correlation
5 .Discrete cosine trasform
6. Real cepstrum
7. Cross spectrum
8. Transfer function
9. Coherence.
10. Total harmonic distortion % and Noise %
11. Two new text files.
12. Reads windows PCM (*.wav) support.
13. Signal overlapping. (samples and %).
14. Hilbert transformer generator and filtering
15. Kaiser parametric window
16. Chebyshev parametric window
17. Zero padder.
19. Higher order spectra: Bispectra and Bicoherence
20. Periodogram.
21. RMS, Mean, Crest, Peak, StDev - Time charts.
22. Peak Amplitude, Phase, frequency - time charts.
23. Wavelets decomposition.
24. Multirate Decimation/Interpolation.
25. Chart cloning.
26. Parametric printing (down/across) (sequential /mulitplexed) of files.
27. Automatic detection of multiplicative components (sidebands and modes)
28. Automatic marking of harmonic components.
29. Interpolation of marked peaks achieving up to 500 times better frequency estimation
+/- 0.1 phase degree estimation, and 1000 times better amplitude estimation then with standard
FFT resolution and considerably better time-frequency resolution (obsoletes Cohens general type of time-frequency distributions).
30. Traces peaks: current or largest.
31. Automatically finds largest peaks.
32. Prints while tracing peaks.
33. Each chart can save: marks, picture, values.
34. Fully configurable marks (color, shape, size...)
35. Single line bispectra/bicoherence analysis.
36. Real time emulator.
37. Last used file list.
38. Drag and drop file capabiliy.
39. Intel Pentium, Pentium II and Pentium III optimized. |
| Version: 2.5 |
Changes from ver 2.0 to 2.5 (November 1998) |
| |
1. Multichanneling. (8 parallel channels.)
2. FIR filter with Designer and speed profiler.
3. Multi-series charts with legend.
4. A new product support: The basic Delphi signal processing package. The package mirrors the main features of FFT Properties with three Delphi components. |
| Version: 2.0 |
Changes from ver 1.0 to 2.0 (September 1998) |
| |
1. Two displays: Time signal, Frequency Spectrum.
2. Power Spectrum
3. RMS Spectrum
4. Phase Spectrum
5. Three input signals support.
6. Separate adjustment of DC, Phase, Frequency and Amplitude.
7. Real time emulation. (Smooth animation)
8. Log/Lin Scale.
9. Static/Dynamic Scale.
10. Single/dual screen display.
11. Import of signals from files.
12 Export of signals to files.
13. Export of charts to: BMP, WMF, JPG, to clipboard and Files.
14. Zoom and panning.
15. Logarithmic amplitude and frequency.
16. Put picture behind the chart.
17. Background of chart can have gradient.
18. 3D free space Waterfall.
19. Three ways of scaling.
20. Averaging: linear and exponential infinite.
21. Separate configuration of charts for screen and paper.
22. Serial printing and page layout. Put 1,2,3,4 charts on signal page.
23. Tutorial on basics of frequency spectrum interpretation.
24. Configurable sample time and samples number (Sampling frequency)
25. Marking of peaks.
26. Completely serialized and automatic signal processing and printing.
27. Chart templates. |
| Version: 1.0 |
Initial capabilities (March 1998) |
| |
Signal generator:* Sinus
* Impulse
* Triangle
* Square
* Transient
* Multiplication
* Delta function
* Gaussian noise
* Random noiseFFT Windows* Rectangular
* Hamming
* Hanning
* Blackman
* Exponent Down.The following phenomena can be observed in combination with the build in signal generator:* FFT and signal type.
* FFT and Window type.
* Amplitude accuracy at different Windows.
* Frequency accuracy at different Windows.
* Power and RMS Amplitude towards normal.
* Phase spectrum and Windows.
* Beating of Amplitude in real time.
* The effect of DC and relation of DC towards signal average.
* FFT aliasing.
* Time signal aliasing. (Sampling)
* The effect of convolution: time signal and rectangular window.
* The effect of non-integer number of periods per Window. (In amplitude and Phase)
* Higher harmonics and aliasing.
* Sum and difference frequencies. |