

Stats Master
Statistical add-on package for MtxVec
One statistics library, with about 300 routines and several ready-to-use components, for Delphi and C++Builder, for .NET and for native C++ — for scientific and engineering analytics, quantitative finance and risk modeling, industrial measurement and lab systems, and real-time diagnostics and streaming computation. It is built on MtxVec — Dew.Math in .NET and native C++ — and runs on every platform MtxVec supports, taking advantage of its vectorized code, symmetric multiprocessing and deterministic, numerically stable computation. It needs no additional DLLs, and full source is available.
Features
Distributions and random numbers
PDF, CDF and inverse CDF for 37 continuous and discrete distributions, with the mean and variance of each, plus the Bose-Einstein and Fermi-Dirac PDF and CDF and the studentized range; random number generators for 20 distributions, the multivariate Gaussian and the multinomial included, in multiple independent streams; fast random sampling; parameter estimation by moments or maximum likelihood; Monte Carlo simulation and bootstrap methods.
Descriptive statistics
Histograms and ogives, cumulative sums and transforms, central and nth moments, percentiles and quantiles, range and IQR, mean, harmonic and trimmed means, median, mode and ranks, scaling and normalization, and outlier detection.
Hypothesis testing
Parametric tests — one-sample and two-sample t-tests, paired or unpaired, the Z-test, F-test, Chi-squared, Bartlett and Hotelling T² — and non-parametric ones — the sign test, Wilcoxon signed-rank, Mann-Whitney U, Kolmogorov-Smirnov, Anderson-Darling, Shapiro-Wilk, Shapiro-Francia, Jarque-Bera and Lilliefors; goodness-of-fit tests, p-values, confidence intervals and power analysis.
Regression and ANOVA
Linear and multiple linear regression, weighted or unweighted; logistic, Poisson and ridge regression; robust regression and constrained optimization; general non-linear regression with the BFGS, Marquardt, conjugate gradient or simplex method; principal component regression; one-way and two-way ANOVA, and ANCOVA.
Multivariate analysis and design of experiments
PCA on the covariance or correlation matrix, PCA residuals, orthogonal rotation of Z-scores and Bartlett's test for dimensionality; factor analysis, item analysis and classical multidimensional scaling; the Hotelling T² and M-Box tests; full factorial and Latin hypercube designs.
Time series and forecasting
The sample ACF and PACF; single, double and triple exponential smoothing; ARMA and ARIMA models — simulation, forecasting and coefficients estimated by Yule-Walker, Burg, the innovations algorithm or maximum likelihood; the ARAR model; moving averages, rolling statistics and the memory-shortening filter; Box-Ljung and Durbin-Watson statistics.
Ready-to-use components
TMtxANOVA for analysis of variance, TMtxMulLinReg for multiple linear regression, TMtxStepwiseReg for stepwise regression with forward, backward and exhaustive search, TMtxNonLinReg and TMtxMultiNonLinReg for non-linear regression, TMtxLogistReg for logistic regression, TMtxPCA for principal component analysis, TMtxHypothesisTest for hypothesis testing, TMtxBinaryTest for binary diagnostic tests and TMtxMDScaling for multidimensional scaling.
Statistical charts
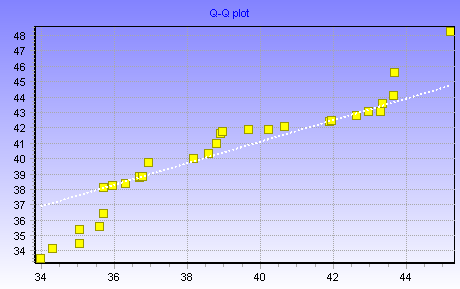
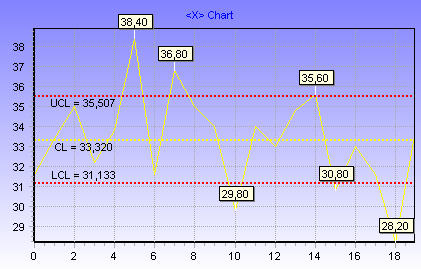
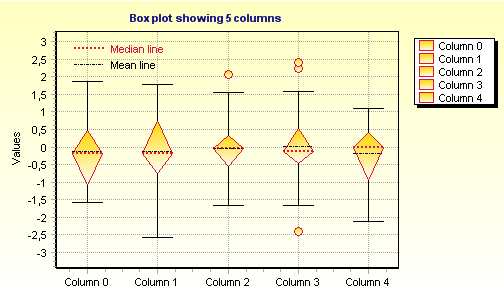
Control-chart routines for X̄, R, S and moving-range charts, P, NP, U and C charts, CUSUM and EWMA charts, the Westgard rules, and the p, Cp and Cpk capability indexes with their confidence intervals. With Steema's TeeChart: probability plots (normal, Weibull, QQ), variable control charts (X̄, R, S and EWMA), attribute control charts (P, NP, U and C), Levey-Jennings, Pareto and process-capability charts, dot plots, box plots, biplots and error ellipses, next to TeeChart's own error, bar, error-bar, pie, box, scatter, 3D scatter, histogram and Pareto series.
Screenshots
Choose your platform
Delphi and C++Builder
The statistical charts on TeeChart for Delphi and C++Builder, the compilers and platforms of MtxVec for Delphi, the documentation and the trial.
.NET
Dew.Stats on NuGet, in the three editions of Dew Math, with Dew.Stats.Tee for TeeChart Pro charts in WinForms.
Native C++
Dew.Stats in standard-compliant C++11, on Dew.Math, in both editions.
Try Stats Master free
Stats Master needs MtxVec. Both come in the Dew Lab Studio installer for Delphi and C++Builder, and in Dew.Lab.Studio on NuGet for .NET.