

FFT Properties
Stand-alone Signal Analyzer and Recorder for Windows
A time series and frequency spectrum analyzer optimized for long signals (Big Data), for scientists, engineers and hobbyists who need the detailed content of a signal: vibration, audio, seismic, speech. It excels at comparing signals and finding what they share and where they differ, the everyday work of fault detection and machine monitoring, and at measuring them accurately in frequency, amplitude and phase.
Two applications
Signal Recorder
Records and analyzes in real time.
- Recording and playback at any sampling frequency, through the fastest sample rate converter, and at 24-bit/96 kHz and 24-bit/192 kHz.
- Monitors and records the output of any playback device.
- A high-resolution spectrogram and a zoom spectrum in real time while recording.
- Envelope and energy computed in real time during recording, with a history overview and frequency analysis.
Signal Analyzer
Takes an in-depth look at what was recorded, with frequency analysis methods found in no other frequency analysis software.
- Opens any audio or video file, down to the multi-channel DTS or AC3 audio tracks of a movie, and reads text, raw or PCM files in any format and WAV files directly; the largest files are analyzed in real time, and complex (analytical) signals are read, written and analyzed.
- A zoom spectrum at higher resolution and in narrower bands at any sampling frequency, averaged spectrums compared with each other, and a 3D surface chart with its own navigation.
- Non-parametric phase angle measurement of non-periodic signals, linear-phase peak filtering, and an analytical spectrogram with the most accurate imaging in an FFT analyzer.
- Multithreaded batch processing for rate conversion, digital filtering, signal generation, modulation, demodulation, envelope detection and signal conversion; rate conversion by any real factor, fast and accurate; a real-time narrow bandpass filter of any bandwidth, limited only by the length of the signal.
- A filter designer with a wide range of optimal FIR and IIR filters, a math expression evaluator for scaling, and an HP-calculator-style signal generator.
- The settings of every processing pipe and chart saved and loaded, and all processing streamed through audio processing pipes.
Features
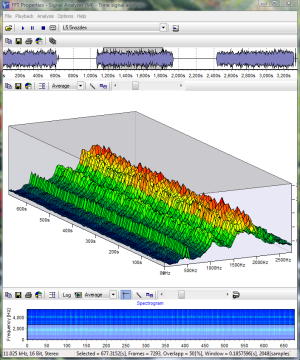
Accurate measurement
The frequency, amplitude and phase of any spectral component, wherever it falls between the frequency bins, measured with peak interpolation, zero padding and parametric windows such as Kaiser. Peaks are marked one at a time, as a harmonic series, as modulation sidebands, as modes or freely, and a marked peak can be filtered out of the signal. From the marks come THD, THD+N, RMS, NF, SFDR, SINAD and SNR, the RMS of any number of frequency bands, and reports you copy to the clipboard.
Spectrograms and surfaces
Spectrograms keep accurate colour in every pixel: you set the window and the overlap, and the image is resampled by average or by peak instead of scaled, so a spectrogram of 50,000 lines and more shows what a real-time one aliases away. The spectrogram analyzer traces the amplitude of chosen frequencies over time, and the surface chart turns through 360 degrees with its axis labels and builds from large files without loss of accuracy.
Files and channels
Up to 32 channels open at once, from any combination of files, navigated and analyzed together. WAV with 8, 16, 24 and 32-bit integer or 32-bit floating-point samples and A-law, μ-law or ADPCM compression; multi-channel text with complex numbers; SFS and ASC text; raw and PCM with a header you define once; and FFT Properties' own DAT format.
Batch and rate processing
Batch processing works through many files on all CPU cores: demultiplexer, multiplexer, digital filter, cross-correlation, signal generator, band flipper, scaling and f(x) expressions, file conversion, cut and copy. Sampling rate processing converts by any real factor, demodulates and modulates a band, and filters narrow bands down to 0.1% of the bandwidth, with anti-aliasing down to -180 dB in the double precision version.
Filters and orbits
The simple filter designer shows the impulse response and the filtered signal while you browse through it. Orbital X-Y analysis draws the path of a shaft's centre in its bearing from two channels, or from one channel through a Hilbert transform.
Listen to it
The human ear is a signal analyzer beyond compare. Playback speed changes on the fly through an accurate rate converter, a zoomed-in section loops, and data that is not audio is amplified to the full dynamic range, up to 24-bit, to be heard.
FFT Properties v3.5
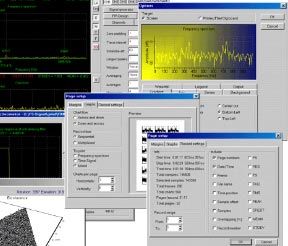
The predecessor, still available
A report-oriented, real-time scope and spectrum analyzer, ideal for studying the fast Fourier transform as well as for practical spectrum analysis, or for the FFT of Excel spreadsheet data; its FFT code is very fast and optimized for Pentium 4 CPUs. Evaluate your sound card for frequency response and non-linearities, tune your guitar, whistle and look at the frequency, make your own car tire balancer, or take a close look at your amplifier. Version 6 does not yet replace all of its features, so it is still a download of its own.
For teaching
It shows what is a property of the signal and what is a property of the FFT: with the built-in signal generator you see how a displayed signal relates to the formula that generated it, and you can listen to what you look at. A frequency analysis tutorial, an interpretation of the DFT formula and a compact introduction to wavelet based signal analysis come with it.
Productivity
A simple interface with a high level of automation for real-world signals: browse through the spectra of the signal records without worrying about chart scaling or axis labels, with or without a logarithmic axis; output in enhanced metafile format is a click away; print large numbers of processed records in high quality charts, with separate chart templates for screen and printer. Designed for pattern recognition, where a huge number of samples must be examined to find the rules of behaviour.
Advanced FFT control
The window functions include two parametric windows, Kaiser and Chebyshev, for control over spectral leakage. High zero padding gives smooth peaks and higher frequency and amplitude accuracy; selected peaks are interpolated in frequency, amplitude and phase without changing the resolution and without zero padding, accurately enough to measure phase directly from the spectrum; peak tracing follows a single peak in time and frequency. The discrete Fourier transform (DFT) is there alongside the FFT, and the built-in signal generator tests every one of these features.
Linear signal processing
An on-line FIR filter designer for multirate decimation and interpolation in a single pass, Hilbert transformers, and low-pass, band-pass, high-pass and band-stop filters. Auto- and cross-correlation, network functions by cross-spectral analysis, phase, real, imaginary, power and amplitude spectra, THD and noise THD, cepstral analysis and the discrete cosine transform.
Non-linear signal processing
Higher order spectral analysis computes bispectra and bicoherence, which detect quadratic phase coupling, with single-line analysis of the surface. It tests whether a peak is a higher harmonic, a product of multiplication or stands alone, with three special peak marking modes that also interpolate, and the phase in the spectrum tells directly how spectral components interact.
Wavelets
On-line wavelet decomposition with a full wavelet decomposition scheme, not wavelet packet analysis: general purpose signal analysis with wavelets, easy to use without any special knowledge of the mathematics behind it.
Choose your platform
Microsoft Store
The Signal Analyzer and the Signal Recorder are two apps on the Microsoft Store, each with a free trial, for Windows 10 (build 17763) or newer on x64 and x86. The Store installs and updates them.
Download for Windows
The trial installs on 64-bit Windows 7 and newer and runs for 30 days; a registration key and a separate full build make it the full version. Versions 5.5, for Windows XP, and 3.5 are still available.
Documentation
The users manual covers the Signal Analyzer. The frequency analysis tutorial and the use cases and examples in the knowledge base were written for version 3.5.
Your own analyzer
FFT Properties is built with Dew Lab Studio. With its components for Delphi, C++Builder and .NET you can write a frequency analyzer of your own, and we can also customize FFT Properties to your needs.
Try FFT Properties free
Try the Signal Analyzer and the Signal Recorder free from the Microsoft Store, or download the trial for Windows.