Fits rational fraction equation to data.
|
Parameters |
Description |
|
B |
Returns regression coefficients for rational function. |
|
X |
Vector of independent variable. |
|
Y |
Vector of dependent variable. |
|
DegNom |
Nominator degree. |
|
DegDenom |
Denominator degree. |
|
Constant |
If false, B[0] i.e. constant term in nominator is set to 0.0. |
|
Weights |
Weights (optional). Weights are used only if they are set. |
The routine fits equations to data by minimizing the sum of squared residuals. The observed values obey the following equation:
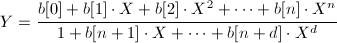
where n and d are nominator and denominator polynomial degrees.
In the following example we generate some data. Then we fit power function to this data and retreive it's regression coefficients.
Uses MtxExpr, MtxVecTee, Series, RegModels;
procedure Example(Series1: TLineSeries);
var Y,YHat,B,X: Vector;
begin
  X.Size(100);
  Y.Size(X);
  X.Ramp(-5,0.05); // X = (-5, -4.95, ...-0.05)
  Y.RandGauss(3.5,0.12); // populate sample data
  FracFit(B,X,Y,2,4); // calculate coefficients, no constant term
  // evaluate y by using calculated coefficients
  FracEval(B.Values,X,YHat,2);
  DrawValues(X,Y,Series1); // draw original data
  DrawValues(X,YHat,Series2); // draw fitted data
end;
#include "MtxExpr.hpp"
#include "Math387.hpp"
#include "RegModels.hpp"
#include "MtxVecTee.hpp"
void __fastcall Example(TLineSeries* Series1, TLineSeries* Series2);
{
  sVector X,Y;
  sVector B, YHat;

  X.Size(100,false);
  Y.Size(X);
  X.Ramp(-5.0, 0.05); // x= -5, -4.95, ...-0.05
  Y.RandGauss(3.5, 0.12); // sample data
  FracFit(B,X,Y,2,4); // calculate coefficients
  // evaluate y by using calculated coefficients
  FracEval(B,X, YHat,2,false);
  DrawValues(X,Y,Series1,false); // draw original data
  DrawValues(X,YHat,Series2,false); // draw fitted data
}
|
Copyright (c) 1999-2025 by Dew Research. All rights reserved.
|
|
What do you think about this topic? Send feedback!
|


 File
File