Visualizing the results with TeeChart
Stats Master uses Steema's TeeChart (both VCL and .NET version supported) to graphically visualize some results of statistical analysis. Using TeeChart you can do pie, bar, scatter, 2d/3d contour, point and surface plots, ... The full list of all supported charting styles is available here.
In addition, Stats Master introduces some additional fully customizable charting styles for quality control charting, probability plots, box plots, dot plots, bi-plots, histograms, ...
Probabilities plots:

The TStatProbSeries can be used to plot special statistical chart types. Series inherits all TPointSeries properties/methods and introduces new properties/methods. Most properties can be customized at design and/or at runtime.
Using TStatProbSeries you can do :
- Normal Probability Plot
- Weibull Probability Plot
- Quantile-Quantile Plot
Quality Control Charts:
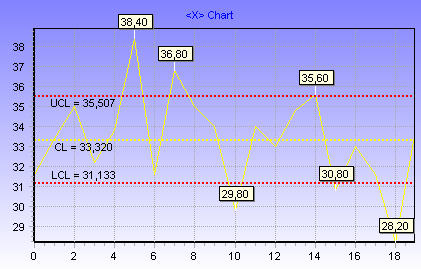
TQCSeries inherits all TLineSeries properties/methods and introduces some new properties which allow you to control centerline, upper and lower control limit values.
TQCSeries can be used to plot most Quality Control Charts. The following QC charts are demonstrated in Stats Master demo:
- Variable Control Charts (XBar, R and S)
- Attribute Control Charts (P, NP, U, C)
- EWMA Chart
- Levey-Jennings Chart
Process capability charts:
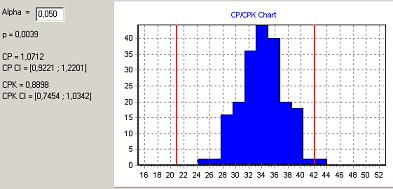
By using TColorLineTool, THistogramSeries and Stats Master routines for calculating p, Cp, and Cpk indexes you can do Process Capability Charts with only few lines of code:
var LB, UB: TSample;
begin
   LB := ChartTool1.Value;
   UB := ChartTool2.Value;
   QCCapIndexes(Data,LB,UB,p,CP,CPK,CPConfInt, CPKConfInt, Alpha);
   Label1.Caption := 'p = ' + FormatFloat('0.0000',p);
   Label3.Caption := 'CP = ' + FormatFloat('0.0000',CP);
   Label4.Caption := 'CPK = ' + FormatFloat('0.0000',CPK);
end;
Box plot:
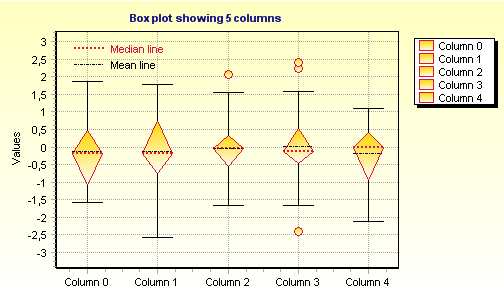
A box plot provides an excellent visual summary of many important aspects of a distribution. Stats Master BoxPlot introduces several properties which allow you to fully control box plot median and mean lines, mild and extreme outliers, etc. As will all other drawing styles, most visual properties are fully customizable.
Two different box plot styles are supported: the box or diamond shape style (the image above showing box plot using diamond shape style).
"Dot" plot:
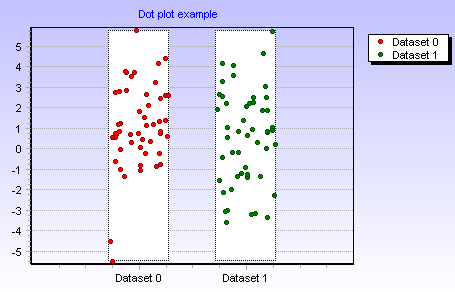
The dot plot is a plot of a single batch of data. One version shows values as points, another version shows values as lines.
In dot plot the vertical axis represents the variable’s values. The horizontal axis represents different groups.
Bi-plot:

Biplots are statistical graphics that represent in the same plane both the variables and the cases. Usually variables are represented by arrows, while points represent cases.